

Police recorded 18,744 crimes in Luton in the year to August, 991 fewer than the year before. Per resident that is the same rate as Bedford. Figures by type.
Police recorded 18,744 crimes in Luton in the 12 months to August 2026. That is 991 fewer than in the previous 12 months, a fall of 5%.
Per resident, Luton’s recorded crime rate is now level with Bedford’s. Both towns come out at about 80 crimes for every 1,000 people, and their rates of violent crime are identical.
The figures come from police.uk, the Home Office’s street-level crime data for every force. We added up every crime that Bedfordshire Police placed in Luton’s five police neighbourhoods, month by month, for the last two years. They do not include anti-social behaviour, which we cover separately below.
Luton’s record on crime has been argued about all week, since a shadow minister’s “no-go zones” comments drew replies from the council leader, the Police and Crime Commissioner and the Bishop of Bedford. Recorded crime cannot settle whether anyone feels unwelcome somewhere. It does show how often crimes are reported to police in Luton, and how that compares with a similar town in the same county.
The quick answer
Bedfordshire Police recorded 18,744 crimes in Luton between September 2025 and August 2026, down from 19,735 a year earlier. That is 79 crimes per 1,000 residents, against 80 in Bedford. Shoplifting, vehicle crime and burglary all fell by more than 16%. Violent crime rose 3%, and anti-social behaviour reports hit a two-year high in August.
What went down, and what went up
These are the totals for the 12 months to August 2026, compared with the 12 months before.
| Type of crime | Sep 2024 to Aug 2025 | Sep 2025 to Aug 2026 | Change |
|---|---|---|---|
| Violence and sexual offences | 7,644 | 7,897 | up 3.3% |
| Shoplifting | 2,147 | 1,798 | down 16.3% |
| Vehicle crime | 1,951 | 1,623 | down 16.8% |
| Public order | 1,594 | 1,456 | down 8.7% |
| Criminal damage and arson | 1,520 | 1,449 | down 4.7% |
| Other theft | 1,605 | 1,398 | down 12.9% |
| Drugs | 985 | 1,061 | up 7.7% |
| Burglary | 674 | 551 | down 18.2% |
| Robbery | 315 | 345 | up 9.5% |
| Possession of weapons | 344 | 331 | down 3.8% |
| Theft from the person | 242 | 246 | up 1.7% |
| Bicycle theft | 179 | 115 | down 35.8% |
| Other crime | 535 | 474 | down 11.4% |
| All crime | 19,735 | 18,744 | down 5.0% |
Violence and sexual offences are the largest group by far, at 42% of the total. The category covers everything from common assault and harassment to serious violence, and police.uk does not split it further.
Drug offences going up is not necessarily bad news. Most drug crimes are recorded only when police find them, so the number tends to rise when officers do more stop and search or targeted operations.
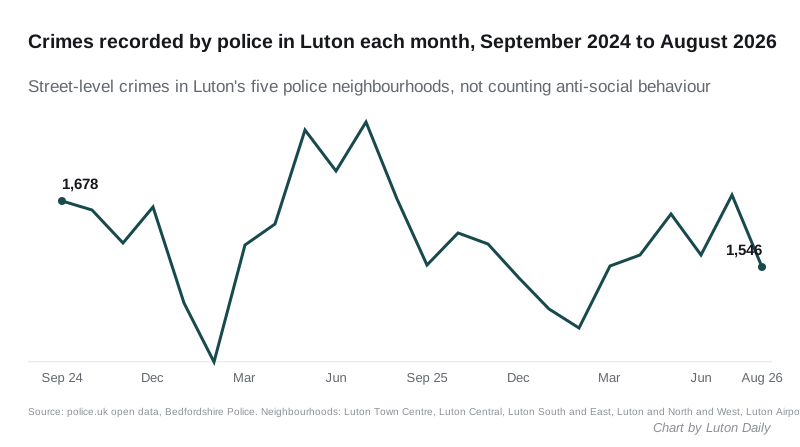
The monthly figures move with the seasons. Crime peaked in summer 2025, at 1,838 in July 2025, and fell to 1,356 in February 2025, the lowest month in the two years. This August, police recorded 1,546 crimes, down from 1,683 in August 2025.
Luton and Bedford side by side
Bedford is the nearest comparison: a town of a similar size, policed by the same force and recorded in the same way. We used the Office for National Statistics’ mid-2025 population estimates, 236,380 for Luton and 196,398 for Bedford (the whole boroughs in both cases).
| Crimes per 1,000 residents, Sep 2025 to Aug 2026 | Luton | Bedford |
|---|---|---|
| All crime | 79.3 | 80.1 |
| Violence and sexual offences | 33.4 | 33.4 |
| Shoplifting | 7.6 | 10.0 |
| Vehicle crime | 6.9 | 5.5 |
| Drugs | 4.5 | 3.5 |
| Burglary | 2.3 | 3.0 |
| Robbery | 1.5 | 1.3 |
| Possession of weapons | 1.4 | 1.1 |
| Anti-social behaviour | 14.2 | 14.9 |
So Luton has a little more vehicle crime, drug crime, robbery and weapons possession per head. Bedford has more shoplifting and burglary. Overall the two rates are within 1%.
Anti-social behaviour: a jump this summer
Anti-social behaviour is reported to police but is not counted as crime. Over the full year it was almost unchanged, with 3,354 reports against 3,322 the year before.
The summer was different. Police logged 456 reports in August 2026, the highest month in the two years we looked at. That compares with 377 in July and 336 in August 2025, so August was up 36% on a year earlier.
Where in Luton
By police neighbourhood, including anti-social behaviour, the year to August broke down like this:
- Luton South and East: 6,451
- Luton Central: 6,289
- Luton and North and West: 5,708
- Luton Town Centre: 3,017
- Luton Airport: 633
The town centre neighbourhood covers only a few streets, so its total is concentrated. The busiest locations police mapped there were “on or near” a shopping area (486 crimes and incidents in the year), a parking area (329), Flowers Way (263) and Bridge Street (210). Police.uk places each report at the nearest of a set of anonymised map points, not at an exact address.
What it means for you
- Check your own street. Police.uk lets you type in a postcode and see the crimes mapped near it each month, with outcomes.
- Report anti-social behaviour, not only crime. Bedfordshire Police takes reports online and on 101; the figures above are how neighbourhood teams decide where to patrol.
- Shoplifting is falling but still common. At 1,798 offences in a year, it is the third most recorded type in Luton after violence and anti-social behaviour.
How we worked out these figures
- We downloaded every street-level crime Bedfordshire Police placed in its five Luton neighbourhoods (Luton Town Centre, Luton Central, Luton South and East, Luton and North and West, and Luton Airport) for each month from September 2024 to August 2026, from the police.uk data API. For Bedford we used the force’s seven Bedford borough neighbourhoods. Each crime was counted once.
- The neighbourhood areas follow the borough boundaries closely but not to the metre, so a handful of crimes near the edges may fall either side.
- These are crimes recorded by police. They depend on people reporting them, and they are not the same as the Crime Survey for England and Wales, which asks people directly.
- August 2026 is the latest month published. Police.uk adds a new month roughly four to eight weeks after it ends.
Related
Sources
- Police.uk open data, Home Office and Bedfordshire Police, street-level crimes September 2024 to August 2026 by neighbourhood.
- Population estimates, local authority, mid-2025, Office for National Statistics via Nomis.
Have your say