
The middle Luton home sold for £315,000, and the June 2026 index average is £289,790, up 1.9%. Prices for all 20 wards, by property type and by postcode.
Luton is the cheapest place to buy a home in Bedfordshire, and it is the only one of the county’s three council areas where prices fell over the past year. The official UK House Price Index puts the average Luton property at £282,653 in May 2026, down 0.7% on the year, while Bedford rose 6.7% and Central Bedfordshire rose 1.8%.
That index figure is not the same as the price on a sold board. To get that, this page also reads every completed sale HM Land Registry recorded in the borough over the twelve months to 31 July 2026: 1,229 sales, with a median of £315,000. Both numbers are below, along with what each Luton ward actually sold for.
The two headline numbers, and why they differ
| Measure | Figure | Period | What it is |
|---|---|---|---|
| UK House Price Index average | £289,790 | June 2026 | Mix-adjusted average across the borough's housing stock, up 1.9% on the year |
| Median sold price | £315,000 | Aug 2025 to Jul 2026 | The middle price of the 1,229 homes that actually changed hands |
The index is designed to track price movement, so it holds the mix of property types steady from month to month. The median is simply the middle of what sold. In a borough where flats are a large share of the housing stock but a small share of sales, those two things pull apart, which is why quoting either one on its own is misleading. The mean of the same 1,229 sales was £317,599, almost identical to the median, so there is no small group of huge sales dragging the figure up.
The June 2026 index, and why last month’s figure moved
HM Land Registry’s UK House Price Index now runs to June 2026, and it puts the mix-adjusted Luton average at £289,790, up 1.9 per cent over the year. Every property type in the borough is rising, and the spread between them is narrow:
| Property type | Index average | Annual change |
|---|---|---|
| Detached | £481,379 | +1.7% |
| Semi-detached | £336,015 | +1.8% |
| Terraced | £269,875 | +1.9% |
| Flat or maisonette | £162,578 | +2.1% |
| First-time buyer | £272,711 | +1.9% |
| Former owner-occupier | £330,250 | +1.8% |
Flats are the cheapest type in Luton by a wide margin, at less than half a semi, and they are also the fastest rising of the four at 2.1 per cent. That is the opposite of the picture in much of the South East, where flats have been the laggard, and it is worth knowing if you are choosing between a Luton flat and a terrace.
One caution about any index figure you read. The UK HPI is revised as more sales are registered, and Luton’s May 2026 average has since been restated from £282,653 to £284,491, a rise of nearly £1,900 for a month that had already been published. Treat the most recent month or two as provisional, and never compare a fresh figure against an old one you noted down earlier: compare like with like from the same release.
What Luton homes sold for, by type
| Property type | Median sold price | Sales | Index average, May 2026 | Annual change |
|---|---|---|---|---|
| Detached | £435,000 | 187 | £469,682 | -0.6% |
| Semi-detached | £335,000 | 559 | £328,050 | +0.6% |
| Terraced | £272,750 | 336 | £262,850 | -0.3% |
| Flat or maisonette | £160,000 | 147 | £158,477 | -5.2% |
The semi-detached house is the Luton market. It accounts for 559 of the 1,229 sales, 45% of everything that changed hands, and at £335,000 it is the number most local buyers and sellers are really dealing with. Flats are the outlier: down 5.2% over the year while every other type moved less than a percentage point. At a £160,000 median they are also the cheapest way into the borough by a wide margin, roughly half the price of a semi.
A first-time buyer in Luton paid an average of £266,004 in May 2026, according to the same index.
Every Luton ward, cheapest to dearest
Luton is a small borough with a wide spread inside it. The gap between the dearest ward and the cheapest is £235,000, which is more than the price of an entire flat in Central ward.
Barnfield tops the list at £400,000, followed by Bramingham (£358,000) and Stopsley (£350,000): the northern and eastern edges of the town, where the housing is later, lower density and closer to open country. At the other end, Central ward has a £165,000 median because almost everything that sells there is a flat, and Biscot (£235,000) and South (£240,000) are dominated by Victorian and Edwardian terraces close to the town centre.
Ward medians are drawn from between 26 and 117 sales each, so treat the ones with the smallest counts as indicative rather than precise. Wards were matched to each sale’s postcode using postcodes.io; all 1,229 sales returned Luton as their local authority, so there is no boundary bleed from Central Bedfordshire in these figures.
By postcode district
| Postcode | Median | Sales | Roughly covers |
|---|---|---|---|
| LU3 | £330,000 | 351 | Bramingham, Sundon Park, Limbury, Marsh Farm |
| LU2 | £327,500 | 443 | Stopsley, Round Green, Wigmore, High Town |
| LU4 | £312,750 | 246 | Leagrave, Lewsey Farm, Hockwell Ring |
| LU1 | £252,000 | 189 | Town centre, South, Farley Hill |
LU1 is the cheapest district by some way, and for the same reason Central ward is: it holds the town centre flats. LU5 and LU6 are not in this table because they are Central Bedfordshire, covering Dunstable and Houghton Regis, not Luton.
The most expensive street in Luton
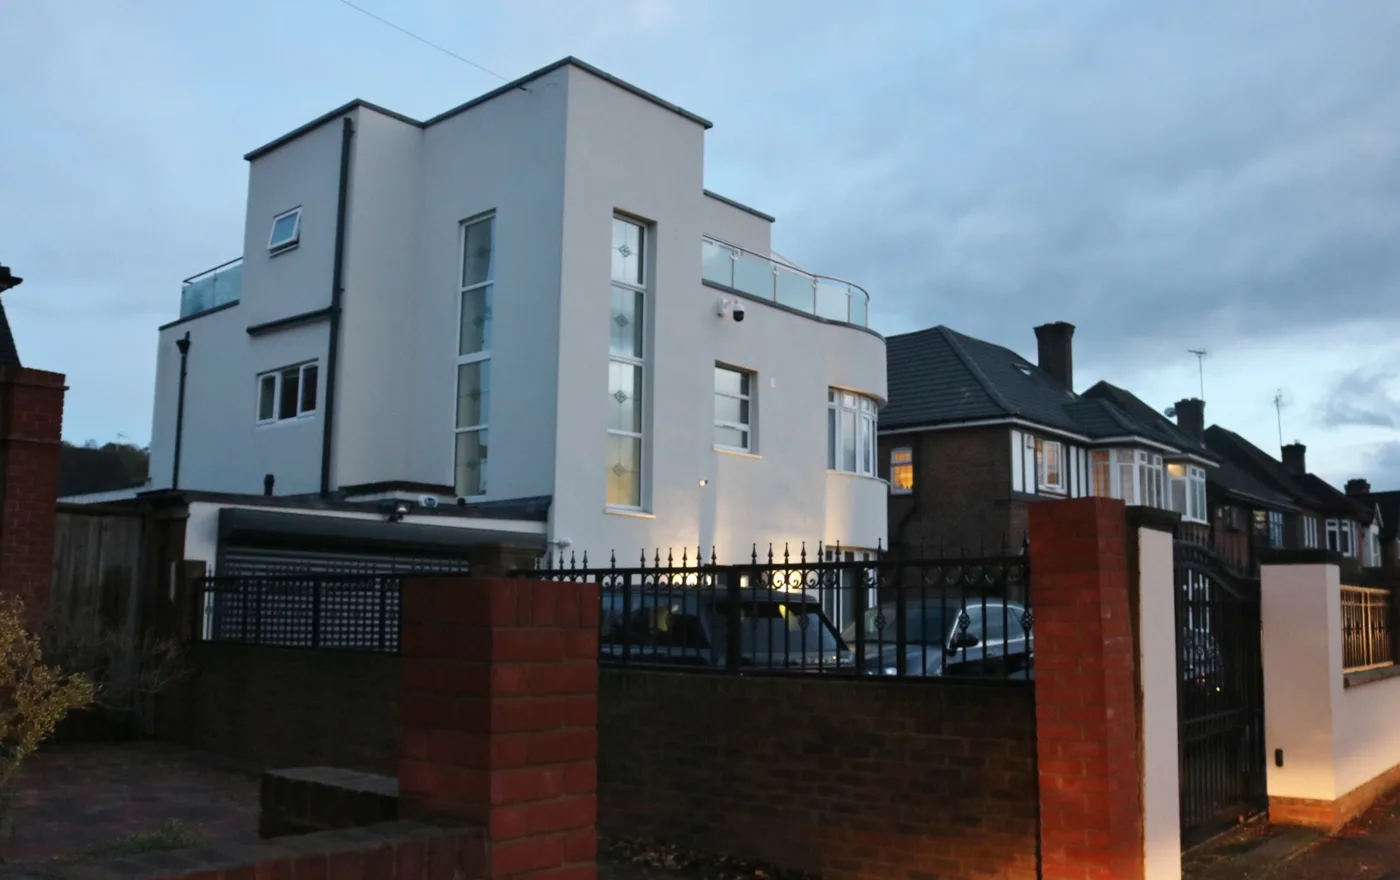
Old Bedford Road is not close. Nine homes on it sold in the year to July 2026 at a median of £780,000, including the borough’s single highest recorded sale: £1,140,000 for 187 Old Bedford Road on 24 October 2025. Five of the town’s ten dearest sales were on that one road. It runs north from the town centre along the edge of Wardown Park, and its large detached and art deco houses are a different market from the rest of Luton.
Behind it, streets with four or more sales and the highest medians were Cutenhoe Road (£490,500), Armstrong Road (£465,000), Gilder Close (£430,000) and Buckingham Drive (£410,000, from seven sales).
How Luton compares
| Area | Average price | Annual change |
|---|---|---|
| Luton | £282,653 | -0.7% |
| Bedford | £332,893 | +6.7% |
| Central Bedfordshire | £354,320 | +1.8% |
| England | £292,095 | +2.3% |
| East of England | £338,224 | +2.3% |
Supply is the other half of the story. Luton cannot currently demonstrate a five-year housing land supply, coming in at 4.64 years with a shortfall of 414 homes, and the sites that would close that gap are years out. The detail is in Luton planning news.
Luton is £71,667 cheaper than Central Bedfordshire next door and slightly below the England average, which is unusual for a town 30 minutes from St Pancras. It is also the only one of the five areas above where prices fell over the year. For anyone commuting, the train fares from Luton are the other half of that sum: a £5,480 annual season is a real cost that a mortgage calculator will not show you.
How this page counts
Every figure here comes from HM Land Registry, either through the UK House Price Index or through the raw Price Paid record for the borough. Two filters matter:
- Only standard sales are counted. Land Registry flags some transactions as “additional price paid”, meaning they were not at full market value: repossessions, part-share transfers and portfolio deals. There were 450 of them in Luton, 27% of all records, and they are excluded here because the Land Registry says not to use them for market analysis.
- Registration lags badly at the recent end. Luton recorded 134 sales in August 2025 but only 34 in June 2026, because sales take months to appear on the register. The most recent months in any Price Paid dataset are incomplete, so a “last three months” average from this source is not reliable.
Frequently asked questions
What is the average house price in Luton?
The UK House Price Index puts the Luton average at £282,653 in May 2026, down 0.7% over the year. The median price of homes that actually sold in the twelve months to July 2026 was higher, at £315,000, because the index adjusts for the borough’s housing mix.
Are Luton house prices going up or down?
Down slightly. Prices fell 0.7% in the year to May 2026, against rises of 6.7% in Bedford, 1.8% in Central Bedfordshire and 2.3% across England. Flats fell hardest, at 5.2%.
Which is the most expensive part of Luton?
Barnfield ward, at a £400,000 median, followed by Bramingham and Stopsley. The most expensive single street is Old Bedford Road, where the median sale was £780,000 and one house went for £1,140,000.
Where are the cheapest houses in Luton?
Central ward at £165,000, which is mostly town-centre flats, then Biscot (£235,000) and South (£240,000). By postcode, LU1 is cheapest at £252,000.
How much is a three-bed semi in Luton?
The median semi-detached house in Luton sold for £335,000 in the year to July 2026. Semis are the most traded property type in the borough, making up 45% of all sales.
Where can I check what a specific house sold for?
Every completed sale in England and Wales is public. Search a street or address free on HM Land Registry Price Paid.
Sources
-
HM Land Registry, UK House Price Index for Luton, June 2026 release, read 31 August 2026, for the index averages, the annual changes and the May revision
-
UK House Price Index, Luton (ONS and HM Land Registry) for average prices, property-type averages, first-time buyer average and annual change.
- HM Land Registry Price Paid Data for the 1,229 standard residential sales in Luton between 1 August 2025 and 31 July 2026, used for all median, ward, postcode and street figures.
- postcodes.io for matching each sale’s postcode to its Luton ward.
- HM Land Registry Price Paid search to look up an individual address.
Land Registry figures were pulled on 13 August 2026 and are revised as more sales complete. Confirm the current position against the linked sources before making a decision.
Have your say