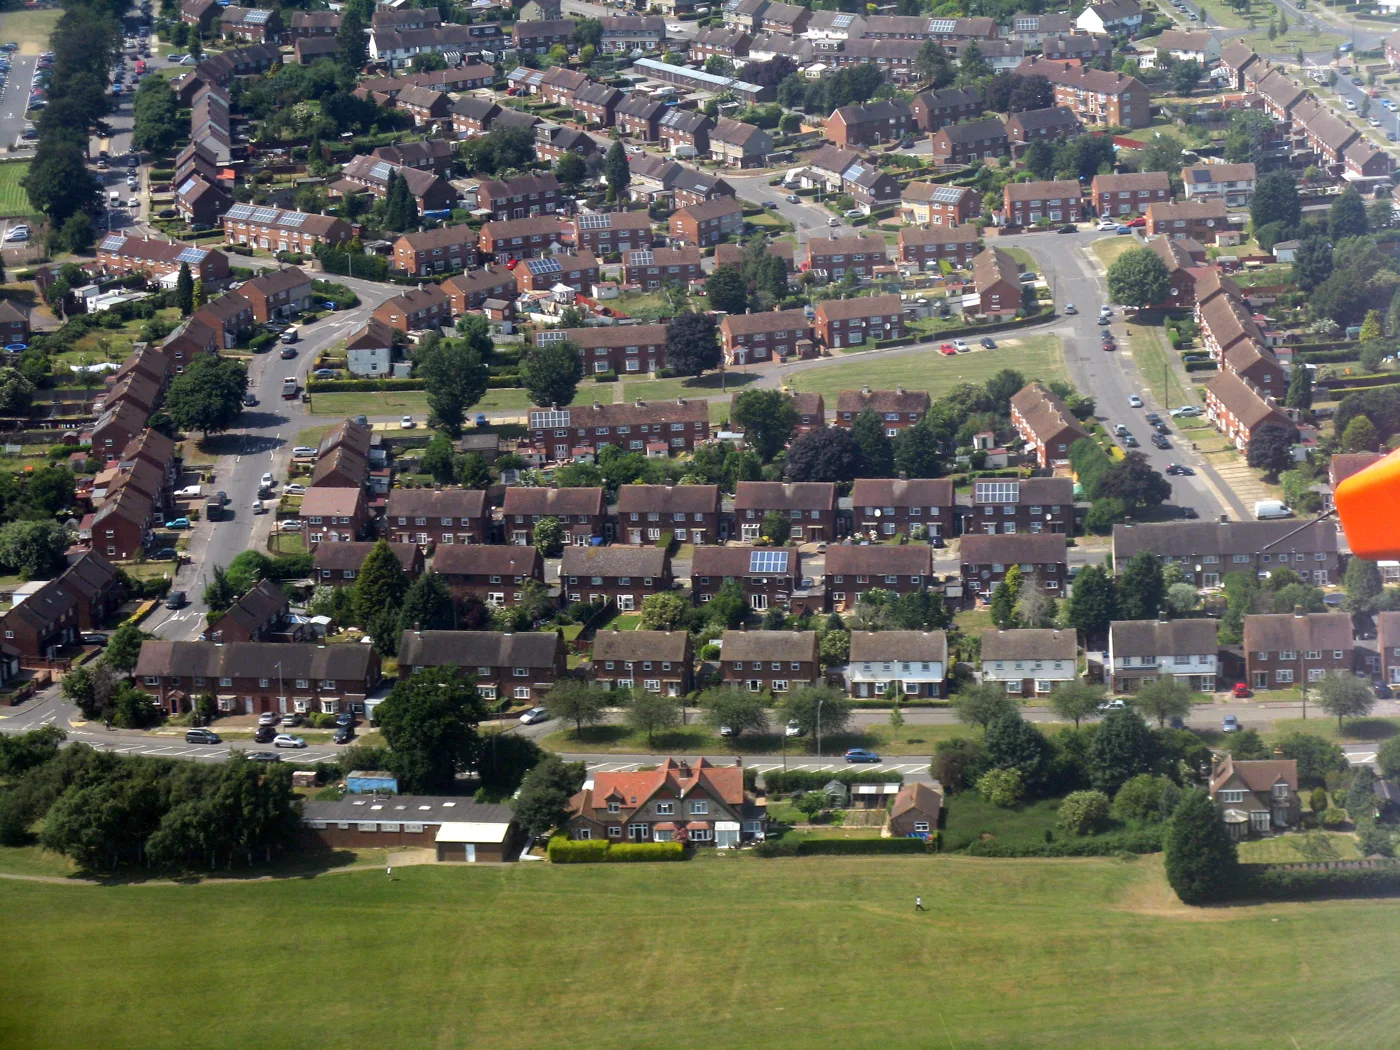

Luton prices turned positive in June after three months of falls, with flats the only type still worth less than a year before. Figures later revised down.
The average Luton home was worth £289,790 in June, 2.9% more than a year earlier, according to the UK House Price Index published by HM Land Registry this morning. That ends three straight months in which prices in the borough were below where they had been a year before.
It is a sharp turn. In April the annual change was minus 2.7%. Two months later it is plus 2.9%.
The recent low was March 2026, at £278,102. Prices have risen £11,688 since, a gain of 4.2% in three months.
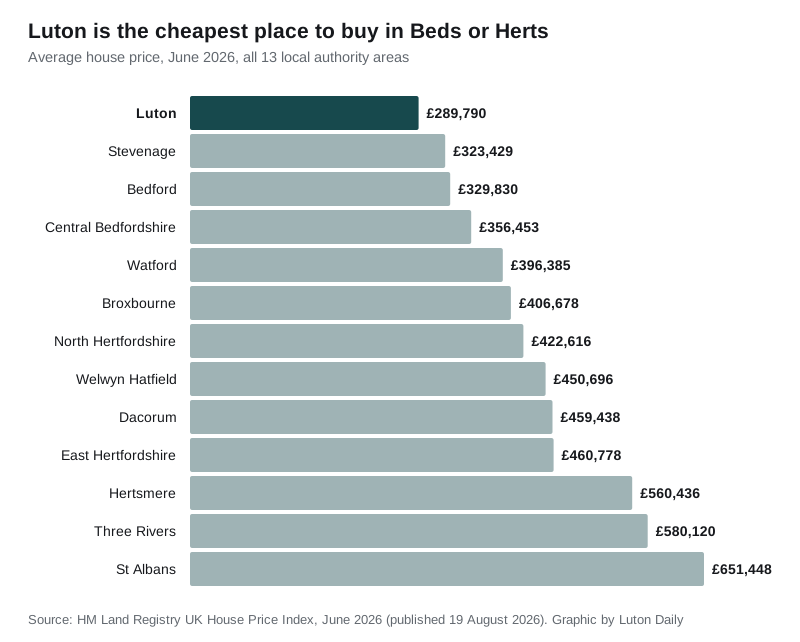
Luton is still the cheapest place to buy in Beds or Herts
Of the 13 local authority areas across Bedfordshire and Hertfordshire, Luton has the lowest average price. The next cheapest is Stevenage at £323,429, which is £33,639 more.
The gap at the top of the table is wide. St Albans averages £651,448, more than twice Luton.
Luton is also below the average for England, which stood at £293,262 in June, and well below the East of England average of £338,707.
That is the whole appeal of the borough to buyers priced out elsewhere on the Thameslink line, and it is why the flat market matters more here than the headline.
Flats are the exception
Every property type in Luton rose over the year except one:
| Type | June 2026 average | Change on the year |
|---|---|---|
| Detached | £481,379 | +2.2% |
| Semi-detached | £336,015 | +3.8% |
| Terraced | £269,875 | +3.6% |
| Flat | £162,578 | -0.3% |
Flats have now been below their year-earlier price for eight months running, since November 2025. The worst reading was minus 6.9% in April. June’s minus 0.3% is very close to the line, so that run may be about to end.
Semi-detached and terraced homes, the bulk of Luton’s housing, did the work in June.
For first-time buyers the average paid was £272,711, up 2.9% on the year. Former owner occupiers paid an average of £330,250, up 2.7%.
How Luton compares nationally
Across the 295 local authority districts in England, Luton’s 2.9% annual rise ranks 143rd, almost exactly mid-table. 62 of those 295 areas fell over the year.
Within the East of England, Luton is 19th of the region’s 45 local authority areas. North Hertfordshire leads on 7.8%. Brentwood is bottom on minus 1.6%.
Two things worth knowing about these figures
The UK House Price Index is a mean average, not a median. It is a modelled figure covering all homes in the borough, not the middle price of the homes that happened to sell. A handful of expensive sales pulls a mean upwards in a way a median resists. Our Luton house prices page reports the median of actual recorded sales, ward by ward, which is a different measure of a different thing. The two numbers are not directly comparable.
The figures get revised. Last month’s release put May at £282,653 and called it an annual fall of 0.7%. This month’s file revises May to £284,491 and a fall of just 0.1%. April was revised the other way, from £282,477 down to £281,682. Early readings move.
Sales volumes lag further still. The Land Registry has not published counts for May or June yet. The most recent is April 2026, with 84 sales recorded in the borough, against 110 in March.
Those numbers are also distorted by the stamp duty threshold change of 1 April 2025. Luton recorded 250 sales in March 2025 and 61 in April 2025 as buyers rushed to complete. Comparing this spring with last spring will mislead you.
What it means for you
If you are selling, the direction has turned, but the level has not moved much in a year. £289,790 in June 2026 against £289,372 in April 2025 is essentially flat over 14 months.
If you are buying a flat, you are the one group still buying at below last year’s prices, though barely. That window looks like it is closing.
If you are a first-time buyer, the £272,711 average is the figure to hold against a mortgage calculator, not the £289,790 headline.
If you are comparing Luton with elsewhere, the £33,639 gap to Stevenage and the £66,663 gap to Central Bedfordshire are what the borough is competing on.
Sources
- UK House Price Index, Luton, to June 2026, HM Land Registry, published 19 August 2026, for the borough average, annual and monthly changes, property type splits, buyer status splits and sales volumes.
- UK HPI full file, June 2026, HM Land Registry, for the comparison of all 295 English local authority districts, the Bedfordshire and Hertfordshire table, and the revisions to the April and May figures.
- About the UK House Price Index, HM Land Registry, for the mean methodology and the revision policy.
Ward-level median prices and prices by property type are on our Luton house prices page.
Correction, 21 September 2026
HM Land Registry has since revised the figures this article was written from. In the July 2026 release, published on 18 September, June’s average for Luton reads £287,839 and an annual change of 2.2%, not the £289,790 and 2.9% reported here. The March 2026 low reads £279,838, not £278,102.
The article has been left as published apart from its title and description, which no longer assert the superseded number. The current figures, and what has happened since, are in Luton house prices, July 2026.
Have your say