
Luton's average house price rose just £164 in a year to £285,800 in August, while rents climbed 3.7% to £1,231. Still the cheapest area to buy in Beds and Herts.
The average Luton home was worth £285,800 in August. That is £164 more than a year earlier, a rise of 0.1%, according to the UK House Price Index published by HM Land Registry and the ONS on 21 October.
Rents are moving much faster. The average private rent in Luton reached £1,231 a month in September, up 3.7% on a year earlier, according to the ONS Price Index of Private Rents.
The index is a mean average, not a median. A handful of expensive sales can lift it, and a run of cheap flats can pull it down.
House prices: flat over the year, up on the month
Prices rose £1,177 (0.4%) between July and August. The July figure has also been revised. We reported £284,946 last month; the Land Registry now puts it at £284,623.
Over the year, the picture is close to standstill:
| Property type | August 2026 average | Change on a year |
|---|---|---|
| Detached | £473,261 | 0.0% |
| Semi-detached | £331,013 | up 0.8% |
| Terraced | £266,988 | up 0.4% |
| Flat or maisonette | £160,283 | down 2.8% |
| All homes | £285,800 | up 0.1% |
The index is set so that January 2023 equals 100, and Luton’s August reading is 99.9. In January 2023 the average Luton home was worth £286,036. It is £236 cheaper now, before inflation is counted.
The first-time buyer average was £269,180, up 0.1% on the year. Homes bought with cash averaged £265,589, down 0.5%. Homes bought with a mortgage averaged £289,180, up 0.1%.
Still the cheapest place to buy in Bedfordshire or Hertfordshire
Across the 13 council areas of the two counties, Luton has the lowest average price. The next cheapest is Stevenage at £309,123, which fell 2.1% over the year. At the other end, the average St Albans home costs £655,974, more than twice the Luton figure.
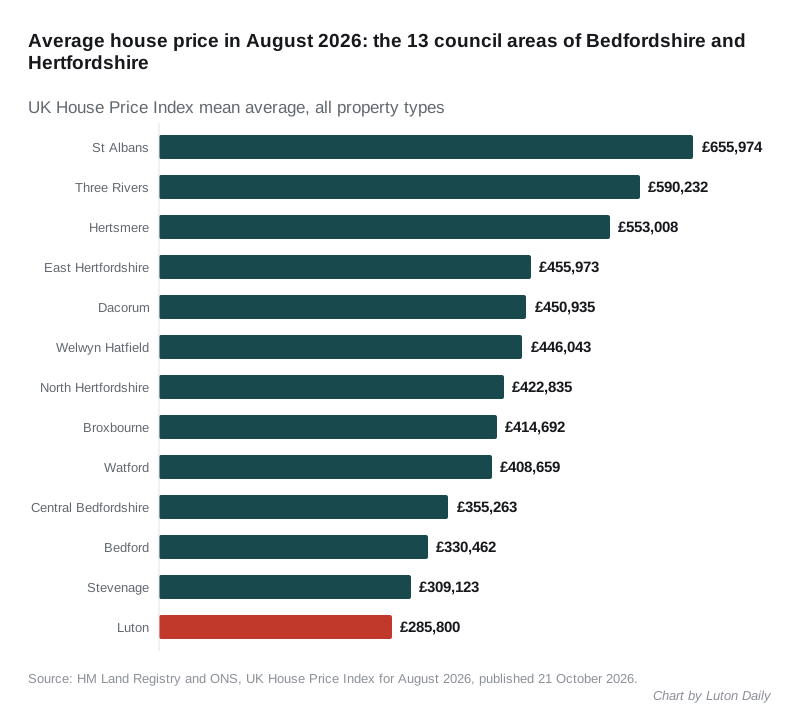
Luton is also below the averages for the region and the country:
- England: £293,525, up 0.4%
- East of England: £337,848, up 0.2%
- Luton: £285,800, up 0.1%
One thing has changed since July. Luton no longer has the cheapest flats in the two counties. Bedford’s average flat is now £159,840, about £440 below Luton’s.
Rents: the slowdown has stopped
From January 2025, rent rises in Luton slowed almost every month. Annual growth fell from 11.3% in January 2025 to 2.4% in June and July this year. It has now picked up two months running, to 2.7% in August and 3.7% in September.
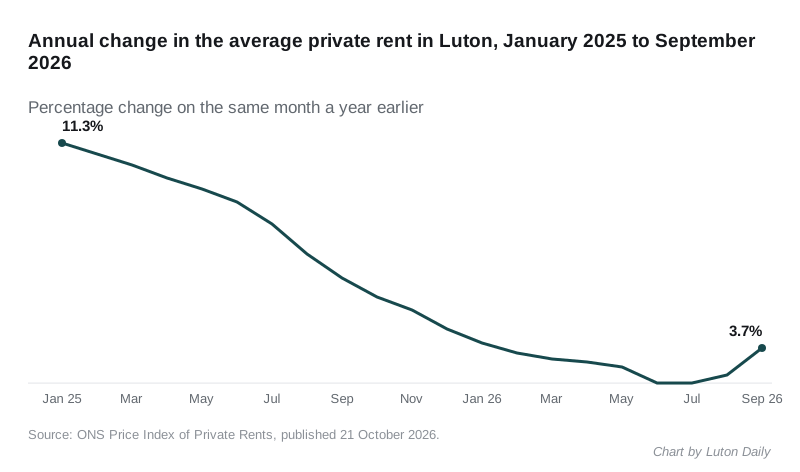
The ONS estimates for September, by size of home:
| Home | Average monthly rent | Change on a year |
|---|---|---|
| One bedroom | £913 | up 3.6% |
| Two bedrooms | £1,122 | up 3.8% |
| Three bedrooms | £1,348 | up 4.1% |
| Four or more bedrooms | £1,829 | up 3.3% |
| All homes | £1,231 | up 3.7% |
Luton is still below the England average of £1,466, which rose 4.0%. Among its neighbours, only Bedford is cheaper:
- Bedford: £1,177, up 2.5%
- Luton: £1,231, up 3.7%
- Central Bedfordshire: £1,258, up 4.4%
- Milton Keynes: £1,346, up 4.0%
- Stevenage: £1,445, up 4.7%
- North Hertfordshire: £1,445, up 6.4%
- Dacorum: £1,613, up 2.5%
The latest rent figures are provisional, and the ONS revises them as more tenancies are recorded.
What it means for you
- If you are buying, prices have barely moved in a year, and the average Luton flat is 2.8% cheaper than it was in August 2025.
- If you are selling a flat, expect the price to come in under what a similar flat fetched in 2025, and check recent sales on our Luton house prices page.
- If you rent, renewals are rising faster again. A 3.7% rise on the £1,231 average adds about £45 a month.
- If you own and rent out, rents are now rising much faster than prices, at 3.7% against 0.1%.
The next house price figures, for September, are due from the Land Registry in November.
Have your say